NYSCF Automated Deep Phenotyping Dataset (ADPD)
Background
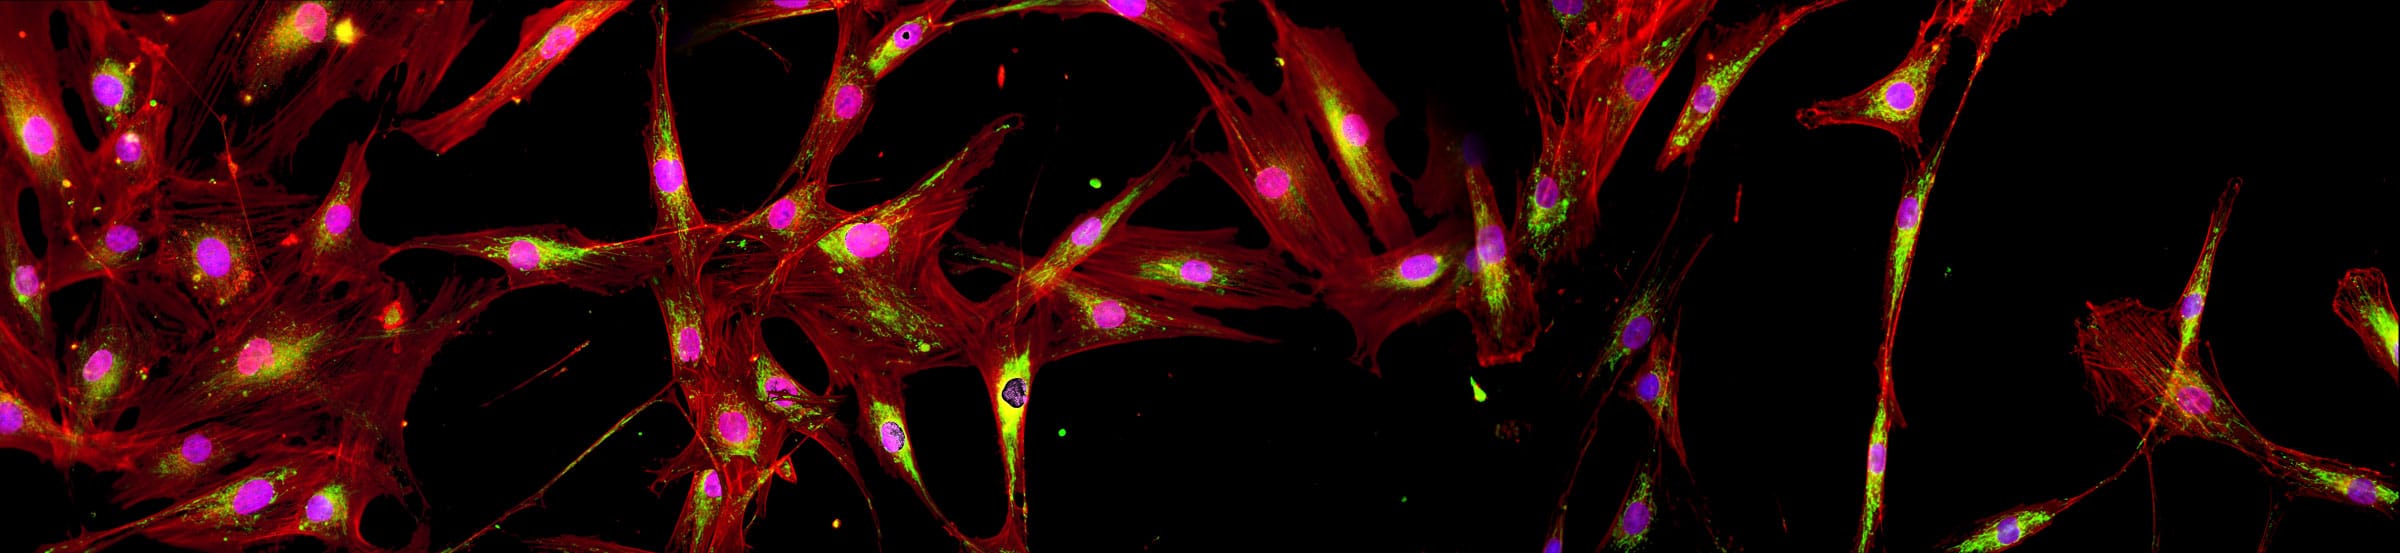
The New York Stem Cell Foundation Research Institute (NYSCF), in collaboration with Google Accelerated Science has built a high-throughput, high-content Cell Painting–based phenotyping platform that combines advanced and scalable cell culture automation with cutting-edge deep learning algorithms. Great care was taken to minimize experimental confounds in the study design, including choice and source of cell lines, automated cell handling and assaying including cell expansion, freeze-down, thawing, seeding and Cell Painting. An important goal of this work was to achieve sufficient reproducibility that analysis and cross-validation could be performed across plates, plate layouts and, most importantly, batches, to create a technical foundation for large-scale, population-based phenotypic profiling and drug screening.
We chose to test our platform on primary fibroblasts from subjects with Parkinson’s disease (PD) and demographically matched healthy controls. Using deep learning in parallel with automated Cell Painting analysis, we were able to confidently separate PD (both sporadic and LRRK2, ROC AUC 0.79 (0.08 standard deviation (SD)) from healthy controls, demonstrating the potential use for this platform for unbiased PD disease modeling and drug discovery. Furthermore, our platform was able to successfully identify a cell line within a cohort of 96 total lines with 91% mean accuracy (6% SD), across batches and plate layouts, demonstrating the robustness of our screening platform and revealing the presence of surprisingly strong individual signatures. Full details of our platform and study are summarized in: [article link]. As part of the publication, the entire dataset of raw and processed images along with example code for reproducing our findings and a near real-time image analysis Fiji macro has been made available to the scientific community, which are detailed below. To our knowledge, this is the largest publicly available Cell Painting–based high-content imaging data set in the world.
NYSCF Automated Deep Phenotyping Dataset 1 (NYSCF-ADPD-1)
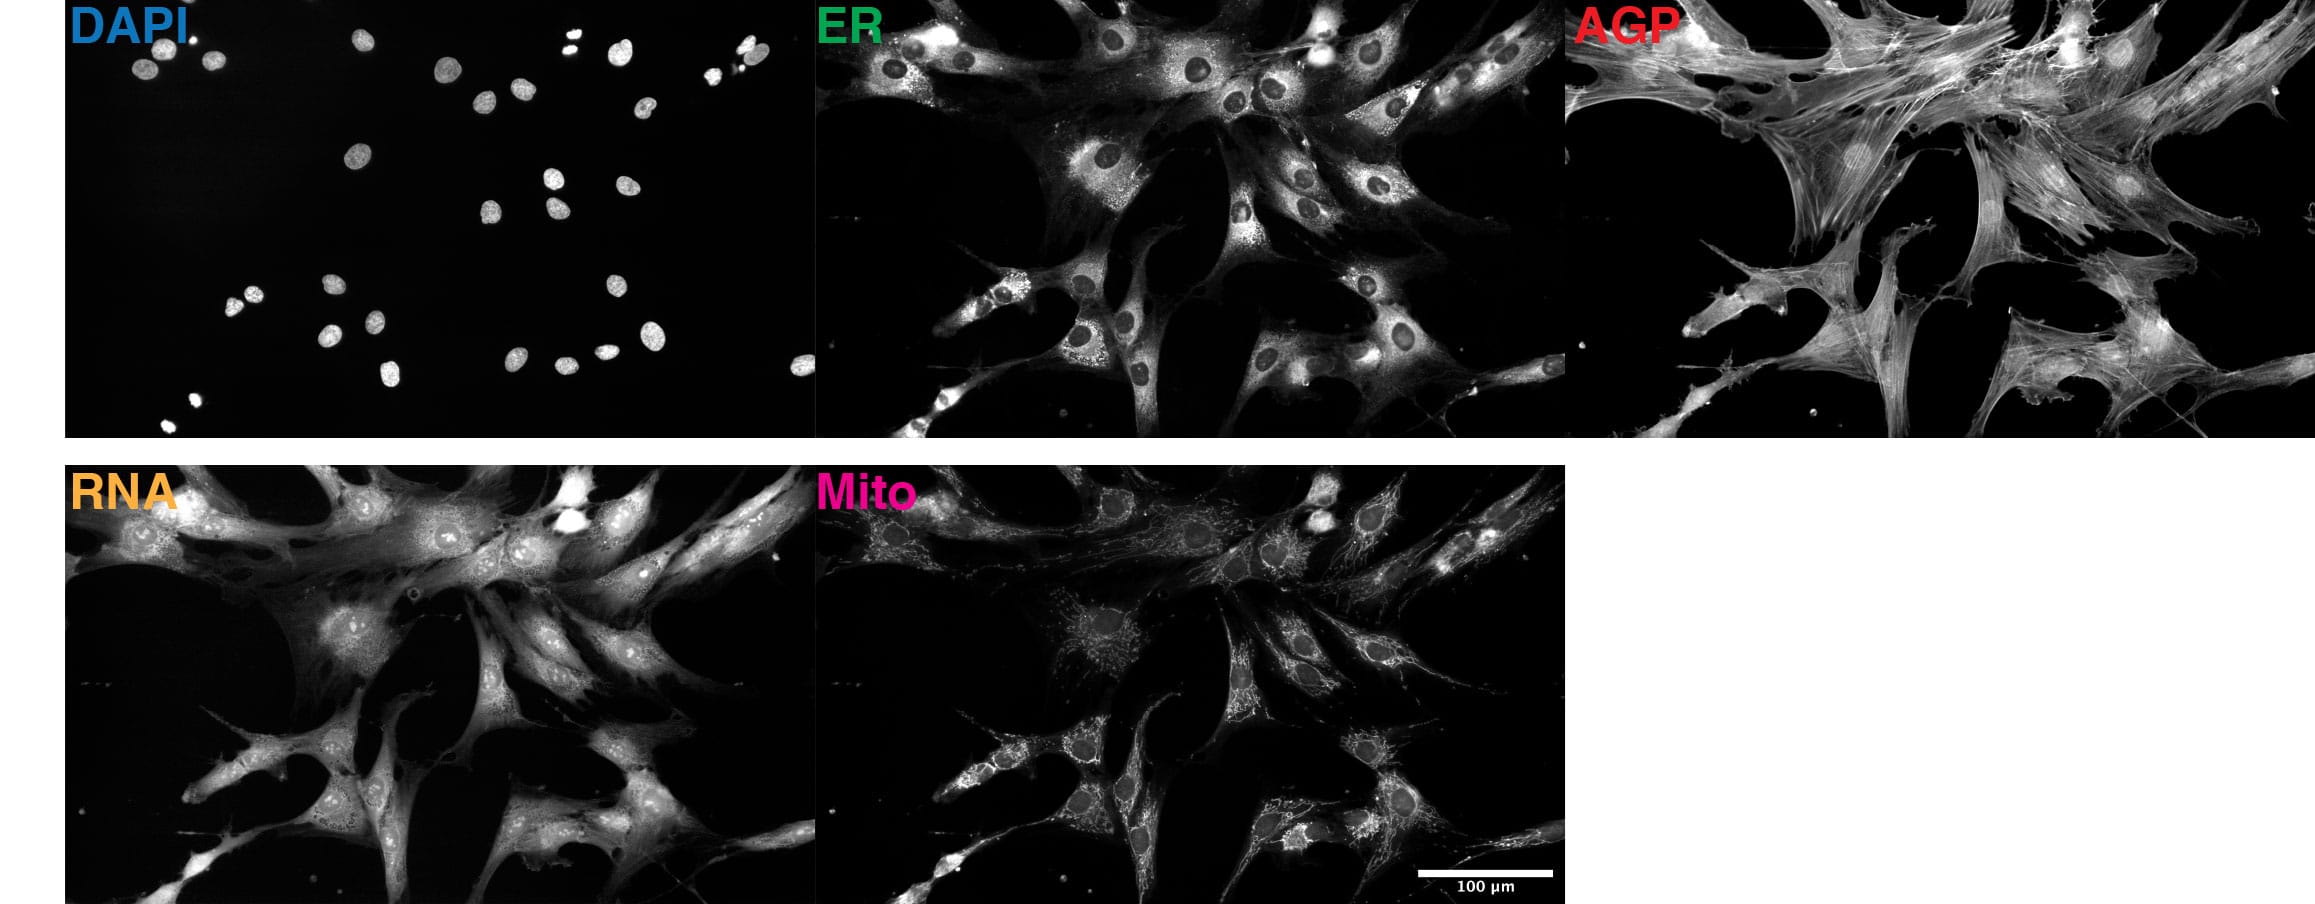
This 48 TB data set contains over 1.7 million full resolution (5056×2960 pixels) Cell Painting images in 16-bit TIFF format. The images were acquired in 5 fluorescent channels using an automated epifluorescence system (Nikon Ti2) and the collection contains images from 4 replicate batches containing 12 96-well plates, each seeded with 96 cell lines from 91 individuals and imaged at 76 tiles per well. The images were pre-processed as described in the publication.
Due to the size of the full resolution image data set, it will be made available to users on hard drives. Please click here to request the full dataset. Please refer to Table 1 for information about available versions of the full image data set. In the filenames, GFP-ER-ConcA is ER, CY3-AGP is AGP, CY5 is MITO and site is tile.
[ninja_tables id=”14498″]
NYSCF Automated Deep Phenotyping Dataset 1 – Junior
For increased accessibility, the NYSCF-ADPD-1 data set has been downsampled to 299×299 pixel resolution (the Inception-v4 deep embedding generator’s input resolution and the same resolution used to generate tile deep embeddings) or a total of 160 GB (uncompressed) and has been made available for download here.
FIJI plugin for near real-time quality analysis
We developed a Fiji-based macro to assess the quality and consistency of the images acquired from a 96-well plate, which is available here. A sample test dataset can be downloaded here.
NYSCF-ADPD-1 Tile deep embeddings and cell image deep embeddings
We computed 320-dimensional deep embedding vectors for both 512×512 cropped cells and full tile images (5056×2960). For this, we used an Inception-v4 CNN pre-trained on the ImageNet object recognition dataset consisting of 1.2 million images of a thousand categories of (non-cell) objects to compute a 64-dimensional deep embedding for each channel, from which the final 320-dimensional deep embedding is obtained by concatenating the 64-dimensional vectors for each channel (in order: DAPI, ER, RNA, AGP and MITO). Table 2 summarizes deep embedding data sources and provides direct download links.
NYSCF-ADPD-1 CellProfiler feature vectors
We used the pipeline template as described in Bray et al Nature Protocols 2016, where we determined cells on the RNA channel, nuclei on the DAPI channel, and cytoplasm by subtracting the nuclei object from the cell object. A 3483-dimensional feature vector was obtained per cell, across 7,450,738 cells. Table 2 summarizes feature data sources and provides direct download links.
This data is licensed under CC BY-NC-SA 4.0![]()
![]()
![]()
![]() .
.
[ninja_tables id=”14494″]
Code Collection
We have made available the necessary code to recapitulate key findings of our paper, including the PD vs. healthy classification and cell-line classification, as well as sample code for generating deep embeddings from microscopy images in the following GitHub repository: